Business Strategy: A Comprehensive Guide to Competitive Advantage
1. Corporate vs. Business Strategy
Corporate Strategy: Defines what products/services to produce and where to compete to maximize long-run profitability.
Business Strategy: Outlines how to compete to create unique value (competitive advantage) by either:
- Providing services consumers value more highly (differentiation)
- Providing similar products at a lower cost (cost leadership)
Strategy: Identifies broad decisions, has a long-term focus, and establishes clear goals.
Tactic: Employs specific actions, has a short-term focus, and creates clear deliverables.
Strategic Position: Requires making tradeoffs – no tradeoff means no sustainable competitive advantage.
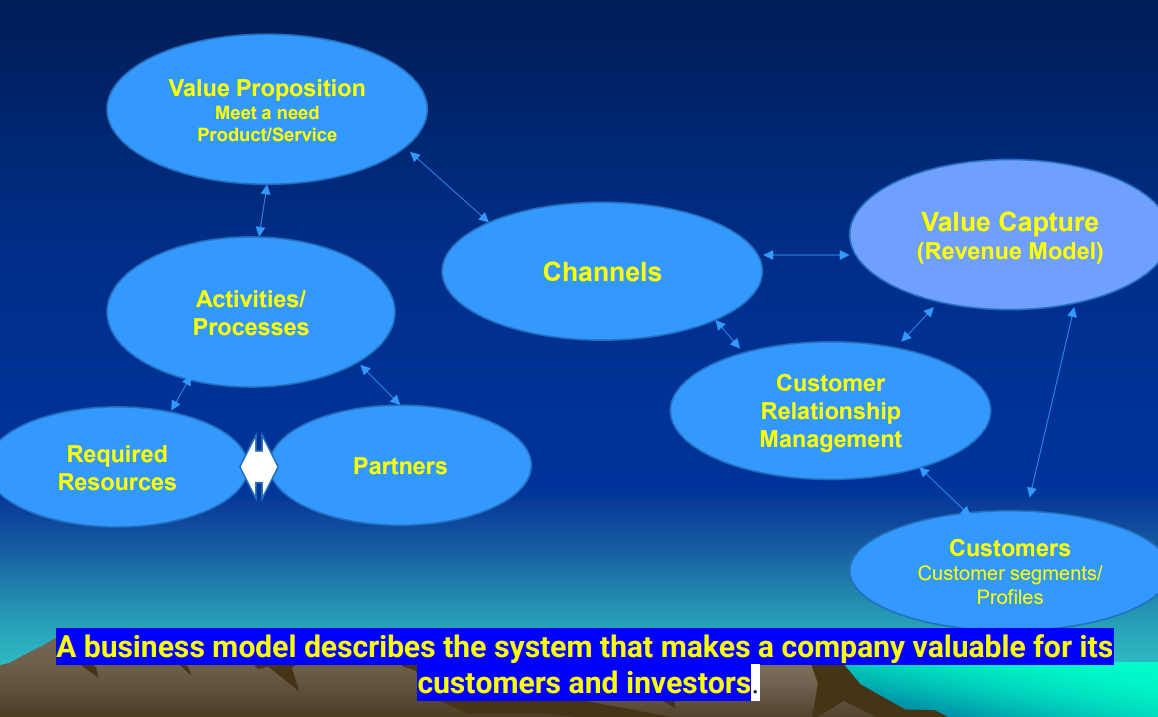
Business Model: Explains how a firm creates value for itself while addressing customer needs. It has two parts:
- Value Proposition: Producing a product or service
- Value Capture: Generating revenue and profit
Value Chain: The set of activities a firm carries out to create value for customers.
- Primary Activities: Directly add value (e.g., production, marketing)
- Secondary Activities: Add value indirectly (e.g., HR, procurement)
Business Model vs. Value Chain: The business model focuses on how a company monetizes value, while the value chain describes how a company organizes itself to create a product.
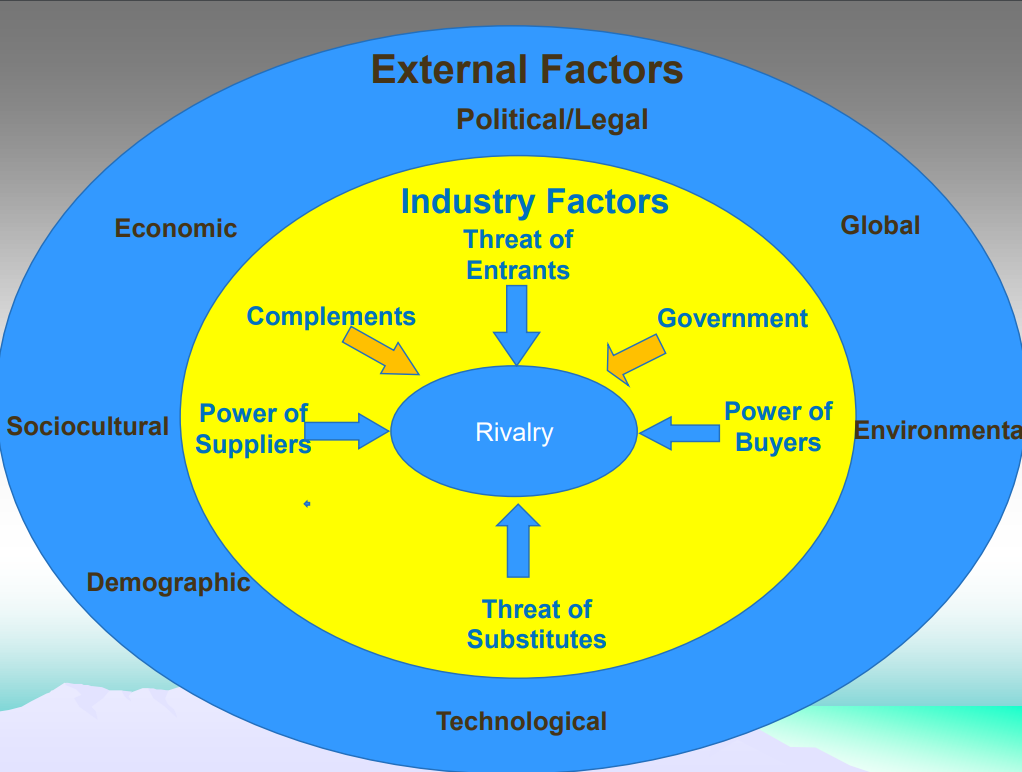
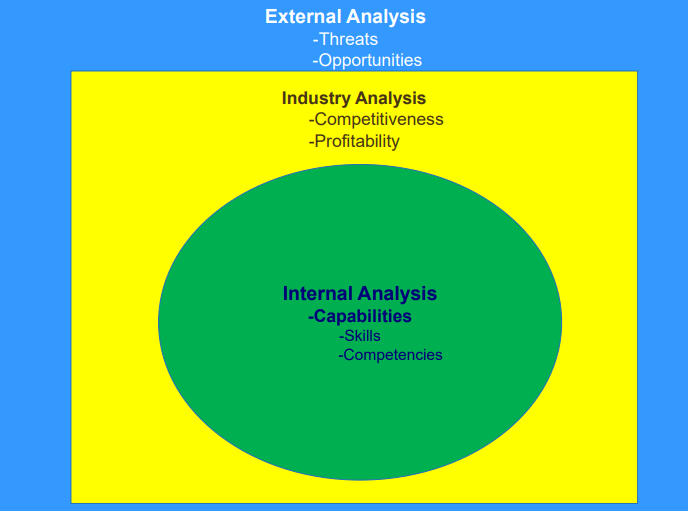
2. External Analysis
PESTEL Analysis: Helps firms understand potential threats and opportunities by examining:
- Political factors (e.g., regulations, trade policies)
- Economic factors (e.g., inflation, interest rates)
- Sociocultural factors (e.g., changing demographics, trends)
- Technological factors (e.g., innovations, automation)
- Environmental factors (e.g., climate change, sustainability)
- Legal factors (e.g., laws, regulations)
Porter’s Five Forces: Helps understand industry boundaries and competitive structure by analyzing:
- Inter-company Competition: Concentrated vs. fragmented; competitive, monopolistic, oligopolistic, monopoly
- Threat of New Entrants: High barriers reduce threat (e.g., pharmaceuticals)
- Supplier Power: Few suppliers mean more power (e.g., Intel)
- Buyer Power: Strong when buyers are concentrated (e.g., Walmart)
- Threat of Substitutes: Alternatives threaten existing products (e.g., streaming vs. cable)
Example: Starbucks
- Inter-company competition: High (local cafes, McDonald’s)
- Threat of Entry: Moderate (easy for small cafes, harder for chains)
- Power of Suppliers: Low
- Power of Buyers: Moderate (customer loyalty)
- Threat of Substitutes: High (other beverages)
3. Industry Analysis
Industry: A group of companies that satisfy similar customer needs, sell similar products (using similar suppliers), and serve customers in the same market. Industry analysis assesses the root causes of profitability.
Industry Life Cycle
- Embryonic: High innovation, low competition
- Growth: Rapid expansion, new entrants
- Shakeout: Slower growth, consolidation
- Maturity: Dominated by a few large firms
- Decline: Shrinking market
Competitiveness: Influenced by entry barriers, rivalry, buyer/supplier power, substitutes, and market structure.
4. Internal Analysis
Internal analysis allows firms to identify sources of competitive advantage, such as resources and competencies.
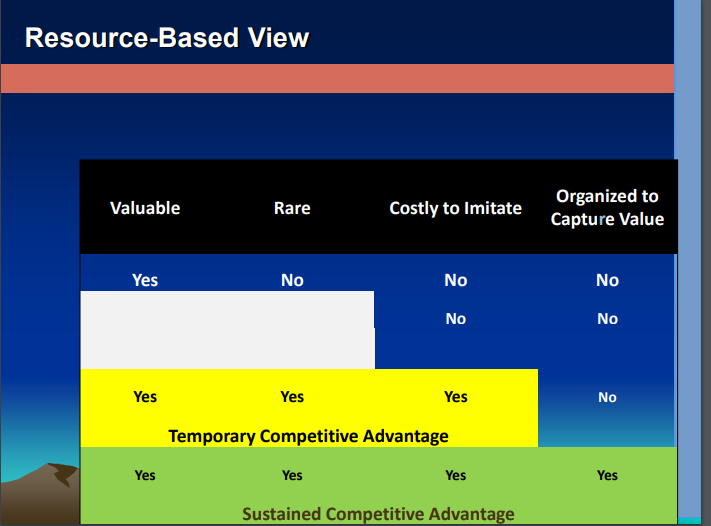
VRIO Framework: Assesses whether resources are:
- Valuable: Exploit opportunities or defend against threats
- Rare: Few firms possess them
- Inimitable: Difficult to copy
- Organized: The firm can effectively exploit them
Core Competencies: The effectiveness with which a firm can take advantage of its resources.
Intangible Resources: Process knowledge, intellectual property, organizational architecture.
Examples:
- IBM: Providing integrated solutions
- Boeing: Product and process innovation
- Google: Superior search algorithm
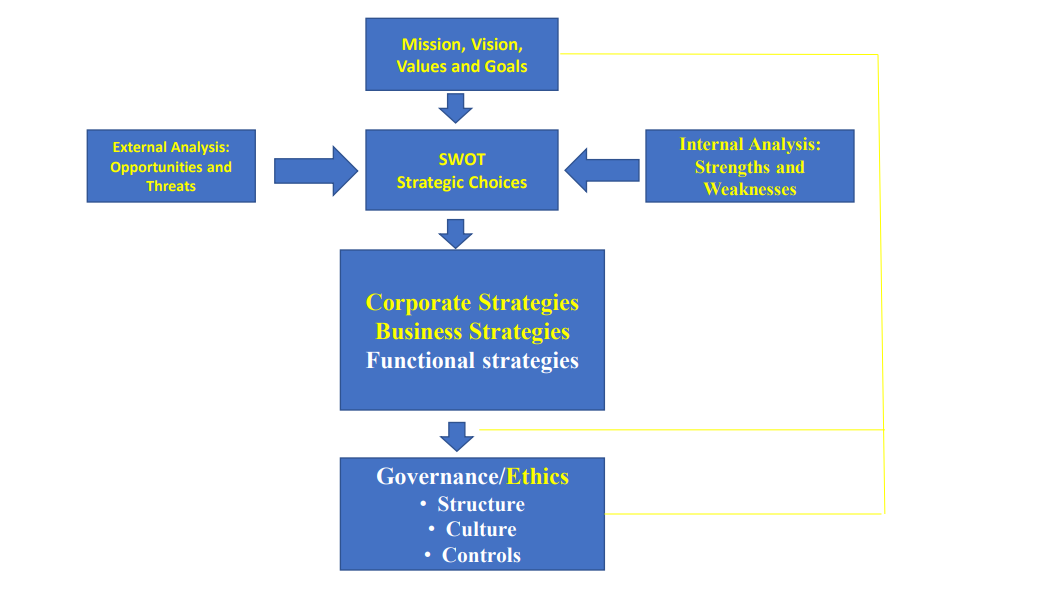
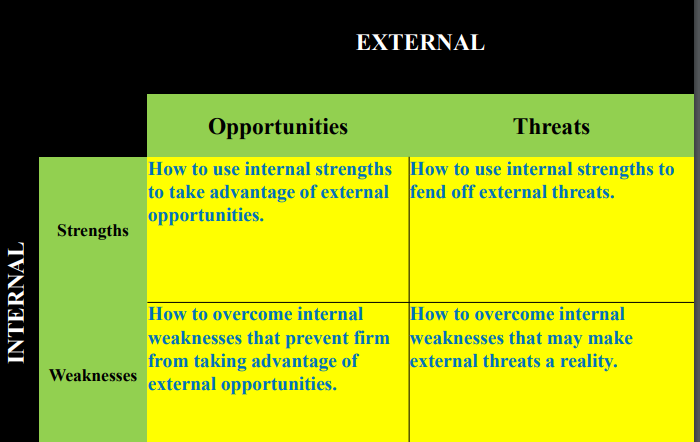
5. SWOT Matrix
The SWOT Matrix is the outcome of external and internal analysis. It identifies:
- Strengths: Internal advantages
- Weaknesses: Internal disadvantages
- Opportunities: External chances for growth
- Threats: External risks to the business
Goal: Use strengths, minimize weaknesses, seize opportunities, and mitigate threats.
Learning Curve: The decrease in average labor cost in repetitive operations as workers gain experience.
Experience Curve: The broader concept that more experience leads to faster and cheaper production across the entire value chain.
Learning Curve vs. Experience Curve: The learning curve focuses on labor cost reduction, while the experience curve considers the cost of the entire product – labor and processes for the whole value chain.
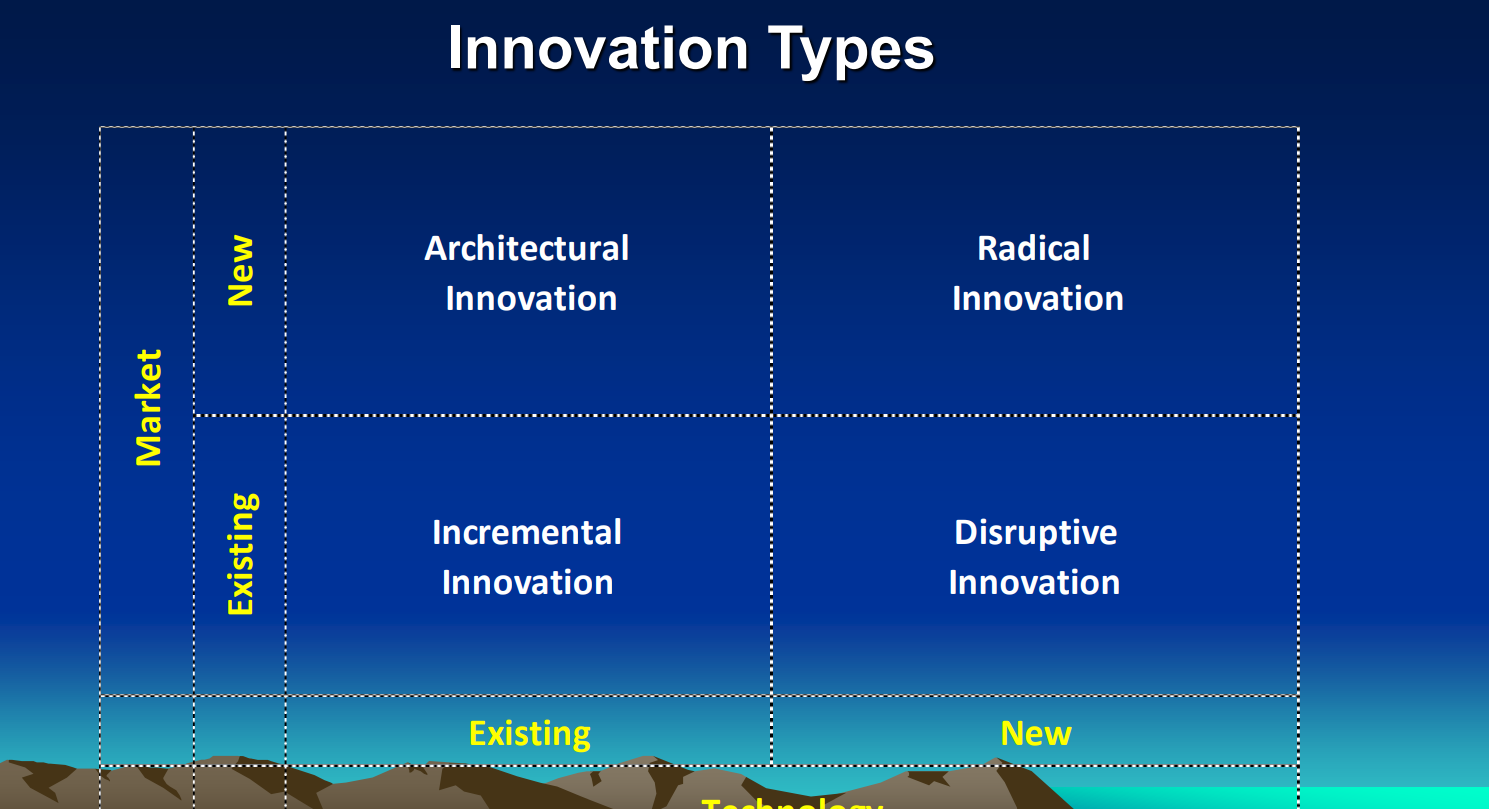
6. Disruptive Innovation
Disruptive Innovation: Targets a down market with disruptive but initially low-performance technology. It advances over time, gains traction in the down market, and slowly replaces established competitors. Disruptive innovations are typically affordable, easy to use, and offer basic features.
Innovation: Something useful, novel, and successfully implemented. It targets a specific market segment to create new value and potentially disrupt the market.
Paradigm Shift: A major change in how businesses produce goods or services, often triggered by emerging technologies or market maturity.
Incumbents:
- Usually cater to the up market
- Strive to please existing customers with improved products and services
- Start investing in novel technologies that have the potential to be disruptive
- Often keep investments in potentially disruptive technologies in separate business units
- May have to cannibalize their established customer base to protect their market share in the long run
Entrants:
- Less likely to succeed by pursuing the same technology as large incumbents
- Focus on disruptive technologies and capabilities
- May need to secure necessary resources and pursue innovation alone or consider strategic alliances with bigger companies if they lack capital
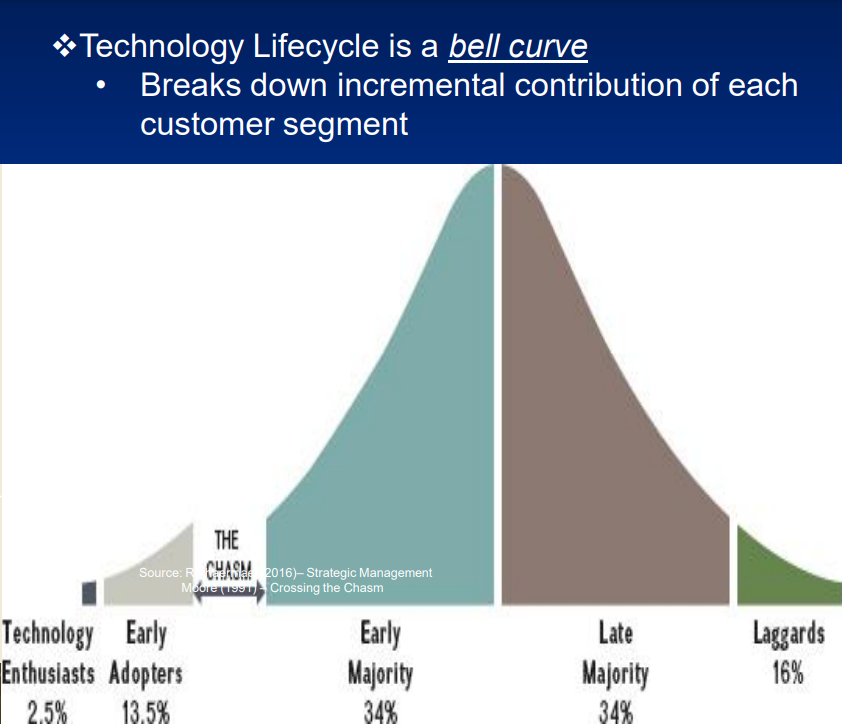
Technology Lifecycle
- Innovators: Eager to try new ideas, have substantial financial resources, and the ability to understand and apply complex technical knowledge. They are risk-takers.
- Early Adopters: More integrated into the social system than innovators; they are opinion leaders who provide advice to others and seek to speed the technology diffusion process.
- Early Majority: The first sizable segment of a population to adopt an innovation. This often occurs when a first mover sees initial success by grabbing market share before competitors enter.
- Late Majority: Will adopt a new product only after the majority does. They are typically older, less affluent, and less educated than the early segments.
- Laggards: Resistant to change and not necessarily influenced by opinion leaders.
7. Competitive Advantage
Short-lived Competitive Advantage: Can be achieved through operational effectiveness.
Sustained Competitive Advantage: Requires creating a unique and valuable position in the market.
Measuring Competitive Advantage
Accounting Data: Backward-looking, does not consider off-balance sheet items, emphasizes tangible assets, and ignores intangibles such as innovation, quality, and customer experience.
Shareholder Value Creation: Measured by total return to shareholders (stock price appreciation + dividends) and market capitalization (dollar value of total shares outstanding).
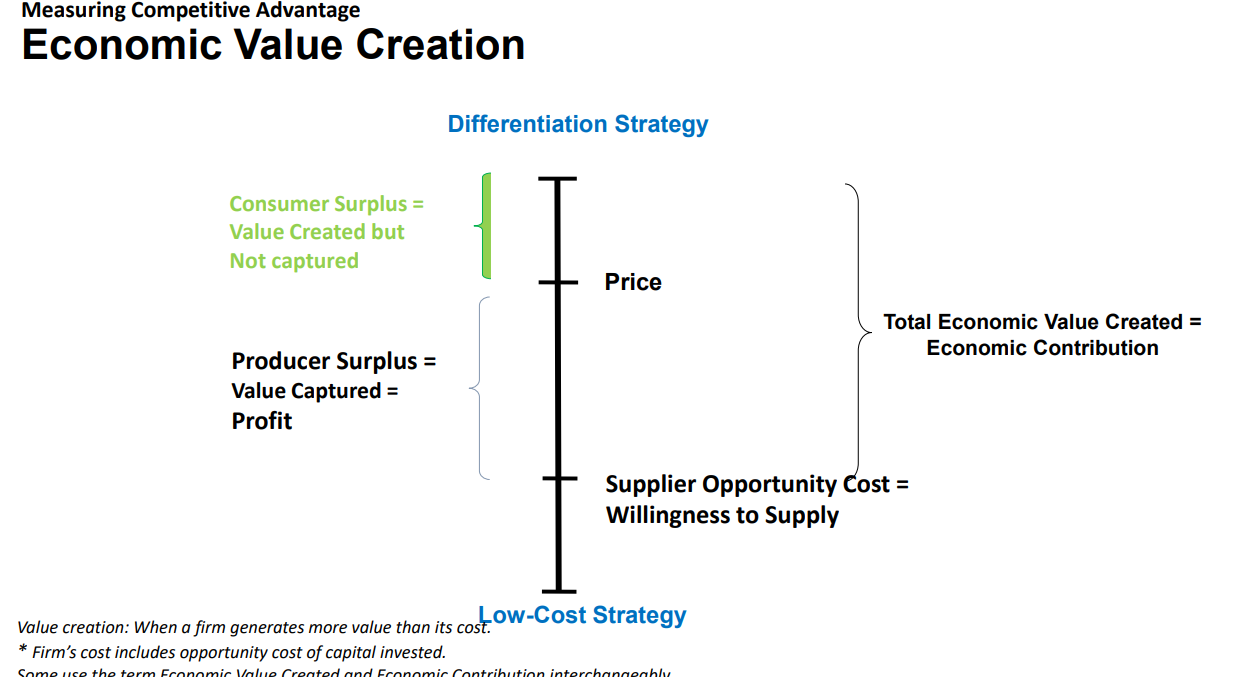
Economic Value Creation: The difference between the buyer’s willingness to pay for a product (value) and the firm’s opportunity cost to produce it (supplier opportunity cost). Uses actual cost.
A firm has a competitive advantage if the wedge it creates between value and opportunity cost is wider than its rivals’.
Consumer Surplus (CS): The amount a buyer is willing to pay minus the price they actually pay (CS = WTP – Price).
Producer Surplus (PS): The difference between the price of a good and the opportunity cost of providing it (PS = Price – Cost).
Total Surplus = Economic Value Created = CS + PS
A firm has an advantage if it creates higher WTP or produces goods at a lower cost.
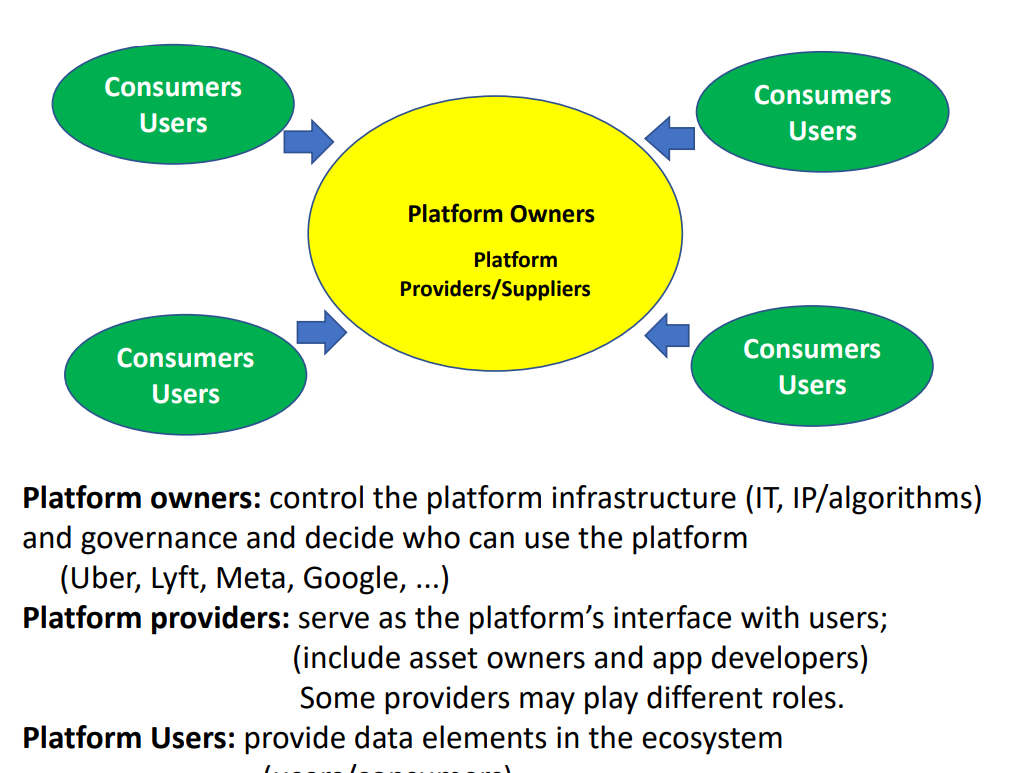
8. Multi-Sided Business Platforms (MSPs)
MSPs: Business models that create value by facilitating exchanges between two or more interdependent groups.
Key Players: Platform owners, platform suppliers (app developers, asset owners), and users (who can also be owners).
Traditional Business Model: Pipeline businesses follow a typical value chain activity system – input materials, production, and product or service as output (e.g., manufacturing a car).
Platform Businesses: Create value by facilitating interactions between consumers and external suppliers or producers. They aim to maximize interactions by increasing the number of producers and consumers.
Traditional: Supply-side focused.
MSP: Demand-side focused.
MSP Value Drivers
- Convenience and accessibility
- Flexibility
- Low cost
- Use of underutilized assets
MSP Attributes
- Trust
- Scale (high fixed costs, low marginal costs)
- Technical competence (algorithms and pricing)
- Brand image
- Effective marketing
- New competencies
MSP Metrics
- Interactional failure (e.g., long wait times causing Uber customers to switch to Lyft)
- Engagement (repeated visits and content sharing)
- Match quality (search results addressing the searcher’s needs)
MSP Conditions
- Each side is affiliated with the MSP
- The MSP enables direct interaction between the two sides
Multihoming: In the sharing economy, both suppliers and consumers can coexist on multiple platforms (e.g., a driver can choose to drive for both Uber and Lyft, and a consumer can use both).
Ridesharing: Industry network effects are relatively weak.
Advantages of Large Networks
- Attract more drivers
- Shorter waiting times for rides
- Attract more riders
- Increase demand for rides (creating a positive feedback loop)