Stock Splits, Dividends, and Financial Statement Analysis
Stock Splits and Book Value
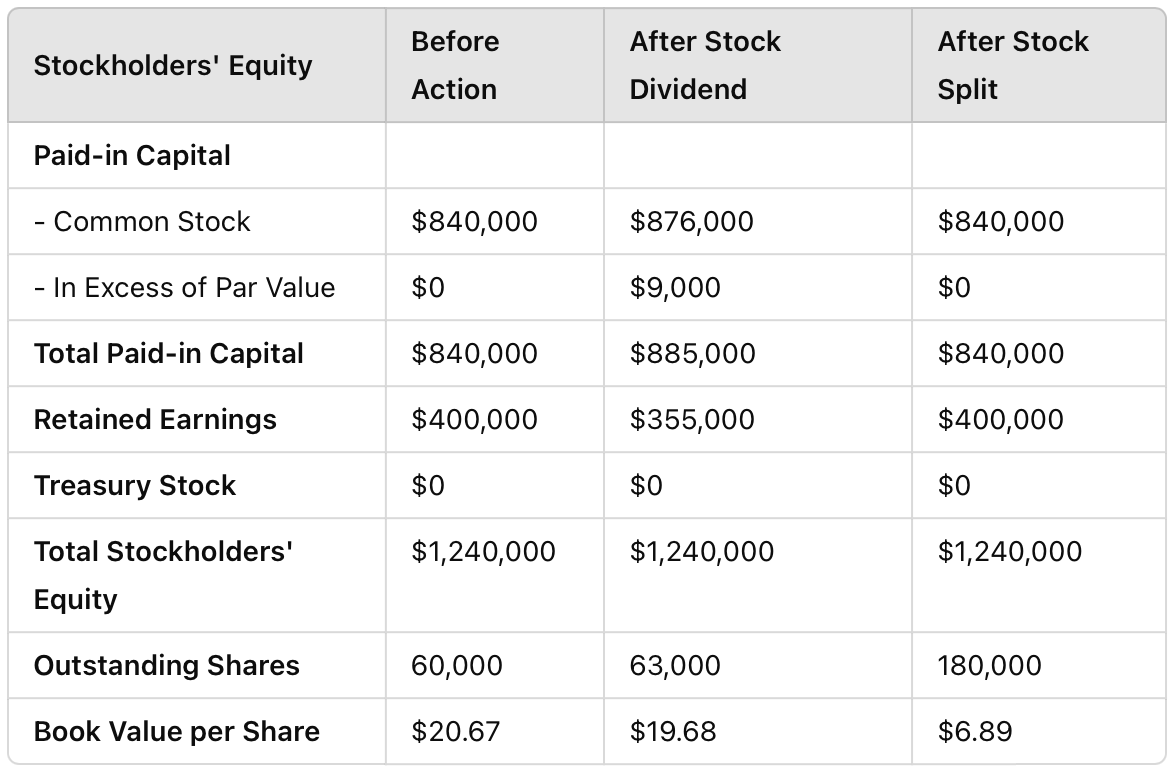
Before Action
Common Stock = 60,000 x $12 = $840,000
Retained Earnings: Given as $400,000.
Total Stockholders’ Equity = $840,000 + $400,000 = $1,240,000
Book Value per Share = $1,240,000 / 60,000 = $20.67
After Stock Split
Total Shares = 60,000 x 3 = 180,000
New Par Value: Reduced to $4 per share.
Common Stock: Total par value remains unchanged = $840,000
Total Stockholders’ Equity = $1,240,000
Book Value per Share: $1,240,000 / 180,000 = $6.89
Stock Dividends and Equity Adjustments
After Stock Dividend
New Shares = 0.05 x 60,000 = 3,000
New Total Shares = 60,000 + 3,000 = 63,000
Par Value of New Shares = 3,000 x $12 = $36,000
Market Value of Dividend = 3,000 x $15 = $45,000
Adjustments:
- Retained Earnings decrease by $45,000 (Market Value of Dividend).
- Common Stock increases by $36,000 (Par Value of New Shares).
- In Excess of Par Value increases by the difference:
Excess Par Value = $45,000 – $36,000 = $9,000
New Totals:
- Common Stock: $840,000 + $36,000 = $876,000.
- Retained Earnings: $400,000 – $45,000 = $355,000
Total Stockholders’ Equity: $1,240,000
Book Value per Share: $1,240,000 / 63,000 = $19.68
Financial Statement Analysis: Apple vs. Microsoft
1) Apple focuses on brand value, trademarks, and design patents, reflecting its emphasis on innovation and product design. In contrast, Microsoft includes software development, intellectual property, and significant goodwill, showcasing its growth through mergers.
2) It belongs to Microsoft because of its $0.01 par value, substantial treasury stock from buybacks, high additional paid-in capital from acquisitions, and large retained earnings that reflect its strong profitability. The total equity also matches Microsoft’s scale as a global tech leader.
3) The Annual Financial Statement where this portion of information appears is the Statement of Comprehensive Income.
4) Is found in the Statement of Cash Flows, particularly within the Investing Activities section.
5) Apple leads in dividends paid, backed by its $60 billion net income, while Microsoft ranks second with $16.6 billion and diversified revenue streams like Office and Azure.
In net income rankings, Apple again takes first place due to its dominance in iPhone sales and services. Alphabet follows in second with $30.7 billion, driven by advertising revenue from platforms like Google and YouTube.
6) This Income Statement likely belongs to Apple due to the high product and service sales, which match its business model. The inclusion of equity-method investment activity also fits Apple’s strategy.
7) The PER ratio can be calculated using the Annual Report if it includes Earnings Per Share (EPS), but the market price of shares must be obtained externally. While the report provides key data, external information is still needed for the calculation.
8) Depreciation applies to tangible assets like equipment, while amortization applies to intangible assets like patents. Both allocate asset costs over their useful lives to reflect their value systematically in Apple’s financial statements.
9) An unrealized gain is when an asset’s value increases, but it hasn’t been sold yet. It’s shown in the Statement of Comprehensive Income because it impacts equity, not net income, since no cash has been received.
10) The company with a greater value of “Vendor non-trade receivables” than “Accounts receivables, net” is Apple.